


Your 2027 goal: $375 per held appointment
Your target: “$375 held,” and it “moves by brand and location within brand.” Today, all brands, total cost of marketing: $345 per appointment set, “closer to $420” per appointment that ran.

| Brand | 3-month goal | Spring stretch |
|---|---|---|
| 58 Foundations | $450 per appointment | 850 a month @ $400 |
| Crawl Space Brothers | $500 per appointment | about 230 a month @ about $476 |
| SafeBasements | $640 per appointment | 118 a month @ $590 |
Cost per appointment set, Google’s count, media only. Volume follows the budget you set. The clock starts when the month 1 tracking fixes are live. Held gets its own number once your held counts by brand are in.
How we count sets and held
Google’s count = “Vanterra Appointment Set - CRM,” the offline import: appointments set from paid clicks, media only.
Held = your CRM’s Estimate import. Your team: “Not only was appointment held but they were able to provide an estimate.” It came back on 55%, 64% and 54% of sets in the last 30 days. That is a minimum: Google credits the click date, so recent appointments are still coming in, and a held appointment with no estimate never shows.
Your own two numbers ($345 per set, about $420 per held) blend to about 82% across all brands. Your held counts by brand settle it.
We restructured the 58 Foundations Google Ads account, then optimized from there
A conversion then was the account’s goal at the time, not an appointment set or held.
What we learned: cost per conversion spiked when budget scaled on short notice in heavy rain seasons. So here, spend steps up only after a brand holds its goal for 2 weeks.
One page logic for every brand
- ZIP code first. One field, on the first screen.
- What are you seeing? One tap, in the homeowner’s words.
- Calculate your free estimate. A price idea before any calendar.
- Schedule last. The appointment is the final step, not the first ask.
We drop the progress bar. Offers become “see if you qualify” (no interest, no payments; a discount).
Why the pages matter: +10% conversion rate ≈ 9% lower cost per appointment, same spend
58 Foundations $450 → about $409 · Crawl Space Brothers $500 → about $455 · SafeBasements $640 → about $582.
- Held, by brand: how many appointments ran last month for 58, Crawl Space Brothers and SafeBasements (or each brand’s show rate)?
- Meta: your CRM sends Meta a “Submit application” for about 3 in 4 appointments set. What marks it: the appointment held, or the estimate given?
58 Foundations: $450 per appointment, then September’s pace
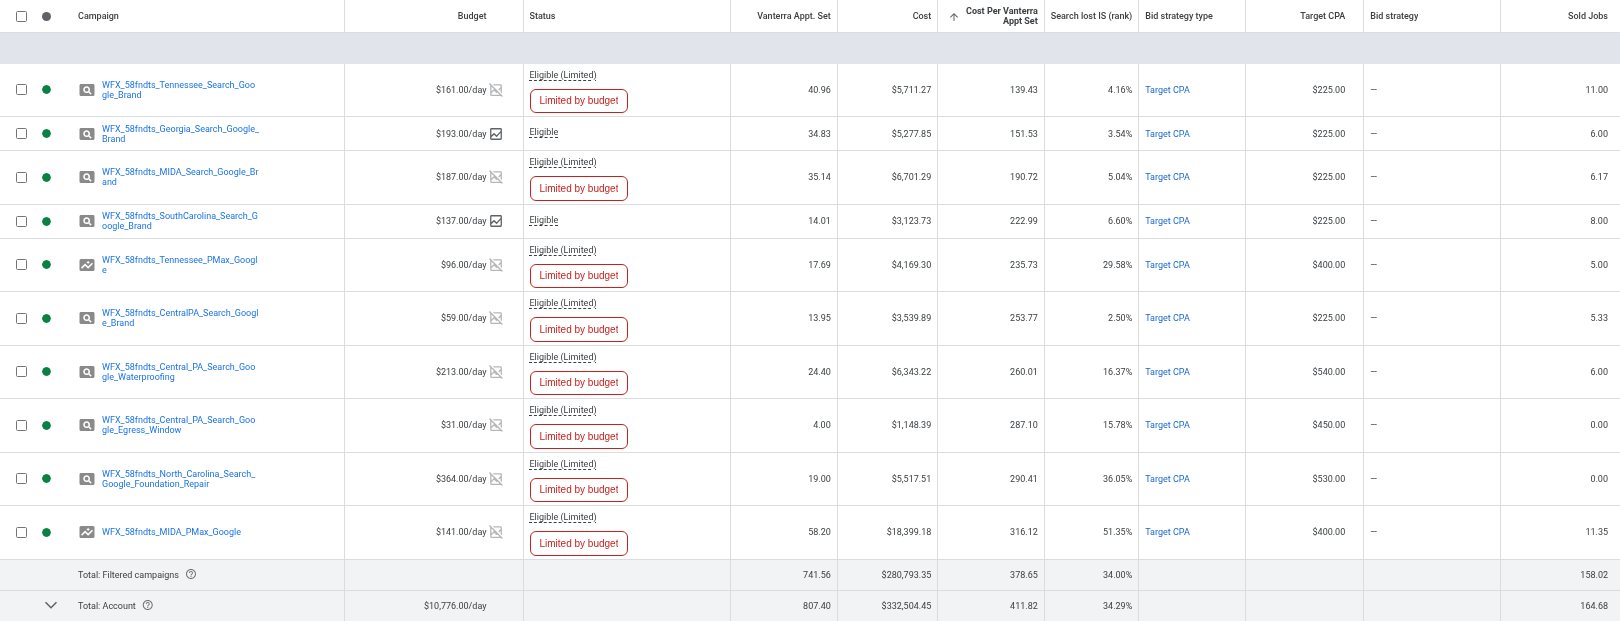
Google’s count, media only. The account already did 807.4 appointments at $412 in September.
At today’s $350,942 a month, $450 buys about 780 appointments. Volume follows the budget you set.
| Window | Spend | Appts (each) | Sold (each) |
|---|---|---|---|
| 90 days 8/20 to 11/17 | $1,052,826 | 2,103.8 ($500) | 357.0 ($2,949) |
| Last 30 10/19 to 11/17 | $311,691 | 565.7 ($551) | 65.5 (still coming in) |
| Best month September | $332,504 | 807.4 ($412) | 164.7 ($2,019) |
| October | $427,889 | 643.2 ($665) | 102.9 (still coming in) |
See it in your account
1Blood Work, under The Foundation Plan
Fix what bidding and the scoreboard read first: widen the Sold import from 30 to 90 days, keep RCFX out of bidding, find why the phone-call import fell.
The number: 46.8% of the sold jobs Google keeps land 7+ days after the click; any after day 30 never count. First Time Phone Call: 693.9 in October, 11 in November 1 to 17.
See it in your account

2Nesting Doll Intent, on Meta
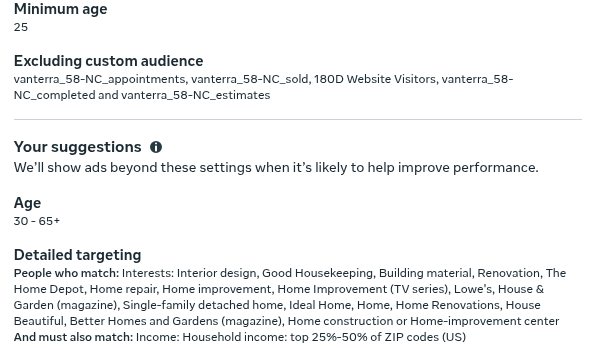
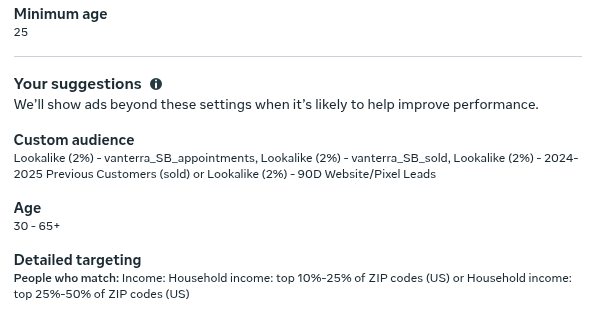
Rebuild prospecting from the center out: retargeting, then one lookalike of booked and sold customers without the income layer, then broad. Interest money moves to what already wins.
The number: lookalike ad sets book Meta’s Schedule event at $398, interest + income at $761 (90 days): about half the cost. Per lead they look the same (about $180 each), so only appointments show the gap, and interest still takes 39% of Meta spend. Schedule comes from your CRM; set or held is unknown.
First moves, The First Aid Kit on Meta: pause the Atlanta and Tennessee interest ad sets ($27,475 in 90 days for 24 Schedules, $1,145 each) and move the money to the lookalikes beside them. If the lookalikes hold their 90-day cost, 58’s Meta cost per Schedule goes from $443 to about $400.
See it in your account (2 screenshots)

3The estimate-first page
Test the estimate-first page (tab 1) on /landing/crawl-space-encapsulation/ against today’s page.
The number: it is the page with the most Search clicks: 1,326 in 30 days, 6.6% to an appointment.
The rest of the list: 4 more plays
4Targets toward $400
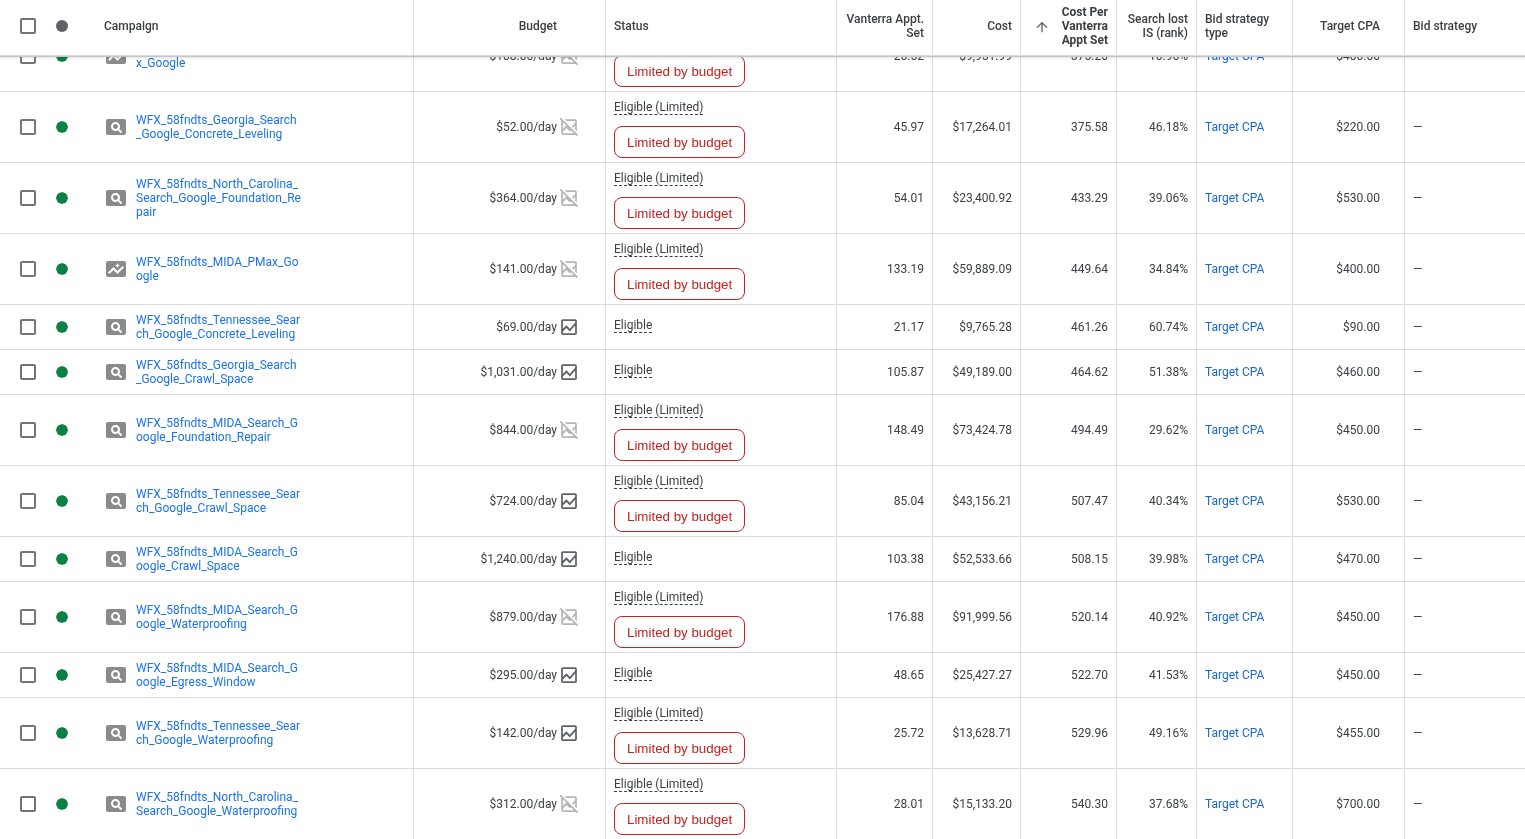
Step each target CPA toward $400 in moves of 20% or less, so Google stops being told to pay more.
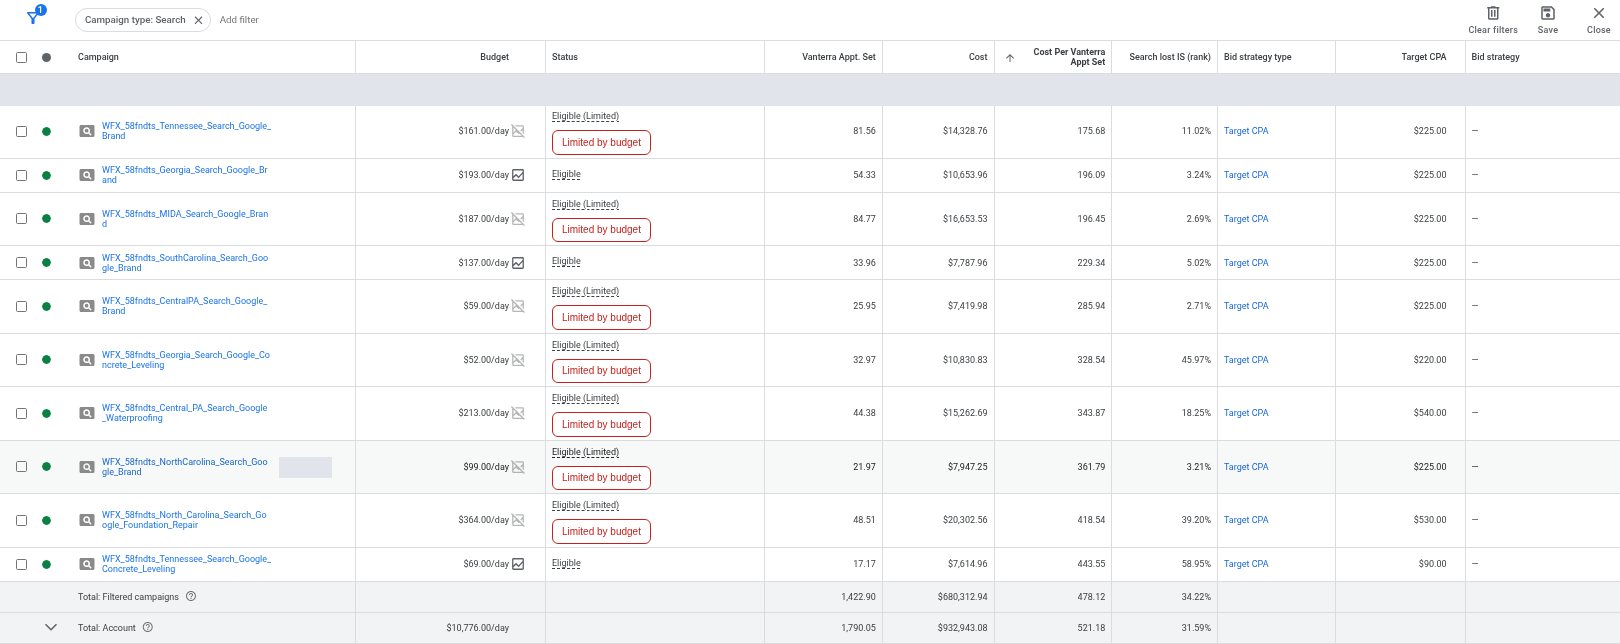
The number: 19 of the 28 live non-brand targets sit above $400 and hold 75.4% of their spend ($646,046 of $856,497).
See it in your account
5Gold Pan Technique, then All-Star Campaigns
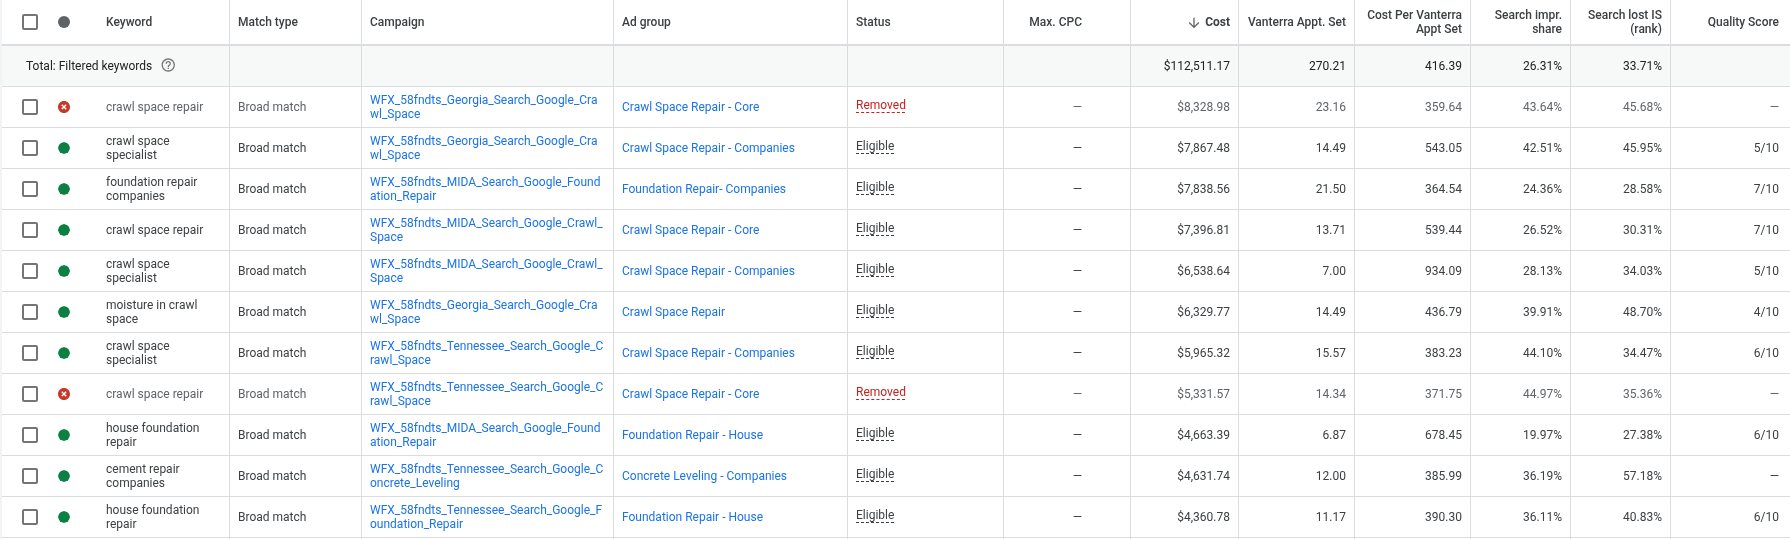
Isolate the keywords already booking under $400 in exact match and fund the impression share they lose, brand first.
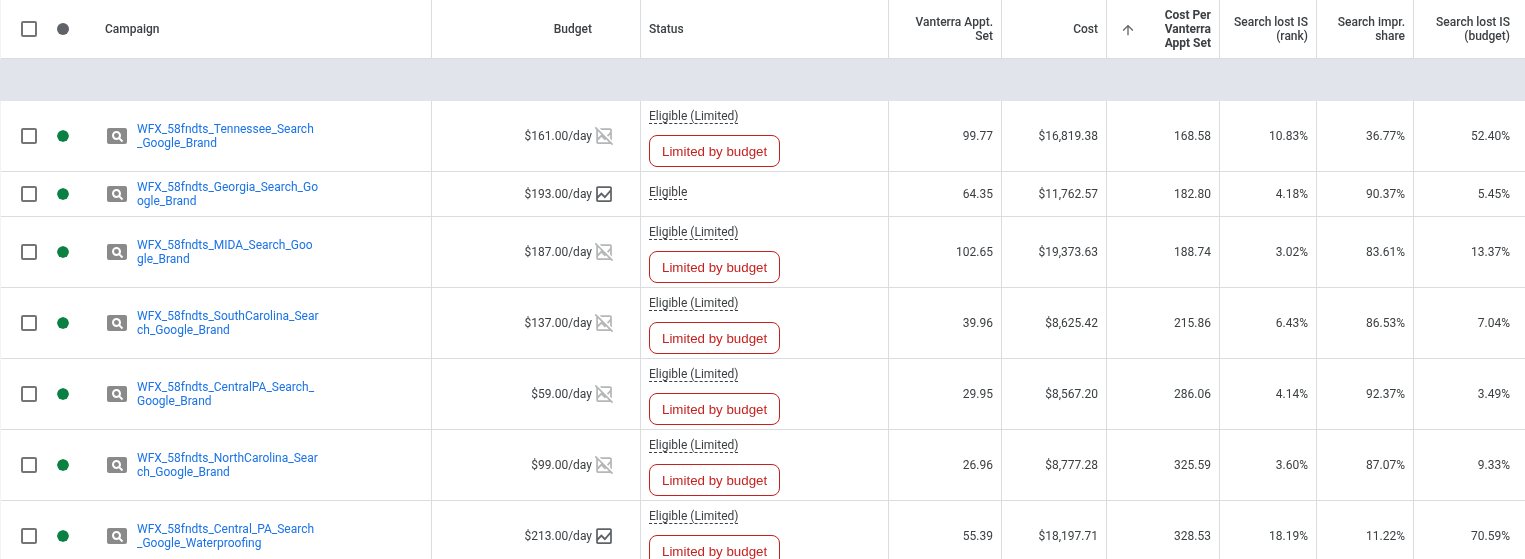
The number: 12 broad keywords book at $323 per bidding conversion (3 of them, $17,670 of the spend, were removed; they come back in exact): up to 76.2 more a month for $24,585 (a ceiling across all 12). Tennessee brand books at $169 and loses 52.4% of its impressions to budget.
See it in your account (2 screenshots)
6The First Aid Kit, then SKAGs vs STAGs
Stop the live ad groups that fail on both appointments and sold jobs, then split the crowded broad ad groups.
The number: 4 ad groups: $25,716 in 90 days ($8,572 a month) for 35.1 appointments at $627 to $896, 1 or fewer sold jobs each.
See it in your account

7The Black Box Break-In
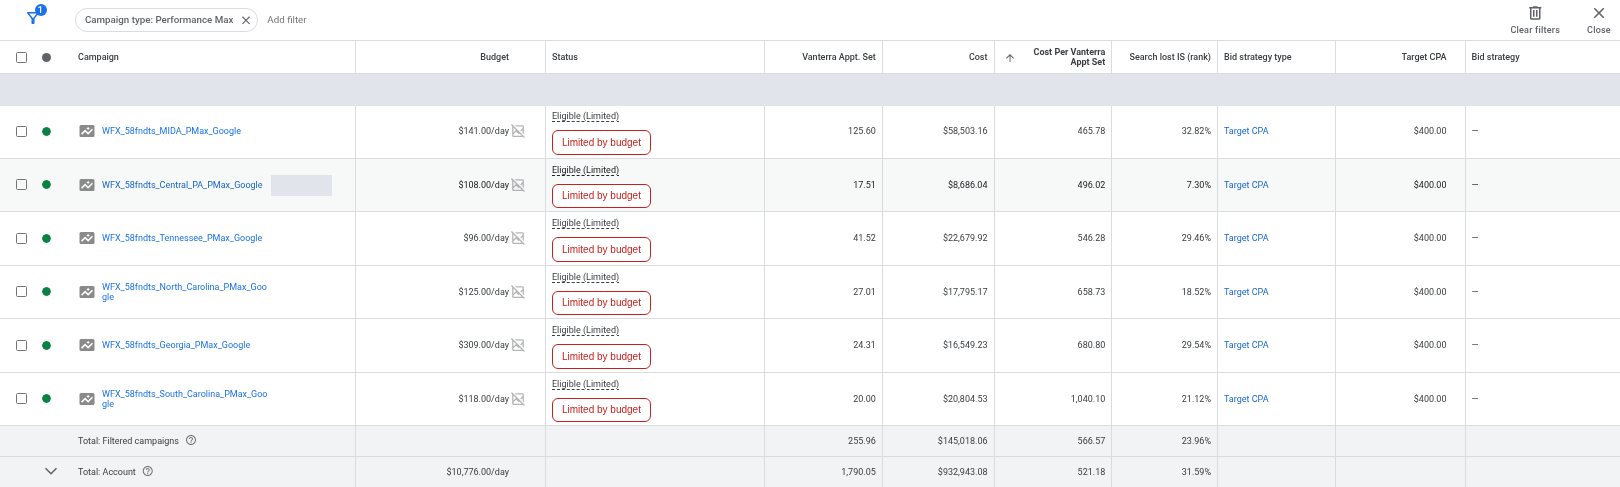
Read PMax search terms and tighten its negatives (the biggest PMax already carries 416, mostly competitor names), hold PMax to the budget that clears $400.
The number: PMax spent $93,836 in October; it books at $567 (Sep 1 to Nov 17) against Search at $478.
Where its clicks go: YouTube took 70% of Google clicks for 3.9% of spend (Oct 20 to Nov 18): 14 appointments at $811.
See it in your account (2 screenshots)
- Google, main account: Search + PMax.
- Meta, main account: prospecting and retargeting. Our read so far covers part of the account; the full grade comes first.
- One landing page test: the estimate-first page (play 3).

Also seen: 8 live LSA accounts, a light pass (they count leads; no CRM import).
What we need from you: why the phone-call import dropped in November · why Sold imports on a 30-day window · who runs which account (WFX_ and Tin_ labels) · Meta’s Schedule arrives by Conversions API only: does your CRM fire it for every appointment set?
Evidence: months, keywords, ad groups
| Month | Spend | PMax | Appts | Each | Sold |
|---|---|---|---|---|---|
| May | $265,681 | $14,049 | 508.1 | $523 | 120.6 |
| Jun | $309,369 | $25,641 | 548.3 | $564 | 119.8 |
| Jul | $384,113 | $23,432 | 865.6 | $444 | 158.6 |
| Aug | $360,236 | $23,085 | 755.9 | $477 | 144.4 |
| Sep | $332,504 | $36,472 | 807.4 | $412 | 164.7 |
| Oct | $427,889 | $93,836 | 643.2 | $665 | 102.9 |
| Nov 1 to 17 | $172,562 | $14,713 | 337.4 | $511 | 27.1 |
October candidates (none proven): PMax went from $23,085 in August to $93,836 in October (4.1x) · RCFX “Leads with Restatements” was 13.9% of October’s bidding conversions · the Tin_ campaigns still spent $46,650 · season. November reads $511 after all three changed.
Gold Pan set: 12 non-brand keywords, at least 10 conversions each, $400 or less: $54,857, 170.1 bidding conversions in 90 days, 34.8% lost to rank, 37.4% to budget. Central PA Waterproofing ($329) loses 70.6% to budget; Central PA PMax ($375) loses 86.4%.
Feed by cost per sold job: Georgia brand $736 · Tennessee brand $761 · Central PA brand $829. Account average $2,949.
Cut list: MIDA Crack Repair $6,919 (10.5 at $659) · MIDA Egress Core $6,897 (11.0 at $627) · MIDA Crawl Space Location $5,976 (6.7 at $896) · NC Encapsulation $5,923 (6.9 at $853). Watch, then cut, once the Sold window is fixed.
Since our June read (May 10 to Jun 8: 495 appointments at $489, 87 sold at $2,786): May as a full month now reads 120.6 sold, so that sold count was still coming in too.
Source: your Google Ads exports, read-only. Keyword costs are per bidding conversion (94.4% Appointment Set, 5.6% RCFX).
Crawl Space Brothers: 10 more appointments a month, no new budget
Google’s count, media only. Move money from what books over target to what books under $400.
We count only 70% of the possible gain. At the goal, about 30 sold jobs a month at 13.9% (a minimum).
| Window | Spend | Appts (each) | Sold (each) |
|---|---|---|---|
| 90 days 8/20 to 11/17 | $324,779 | 552.4 ($588) | 76.9 ($4,226) |
| Last 30 10/19 to 11/17 | $109,294 | 208.5 ($524) | still coming in |
| Best full month October | $136,941 | 234.4 ($584) | 40.3 (still coming in) |
1Gold Pan Technique
Put budget behind what already books under $400, in exact match, and fund the impression share it loses to budget.
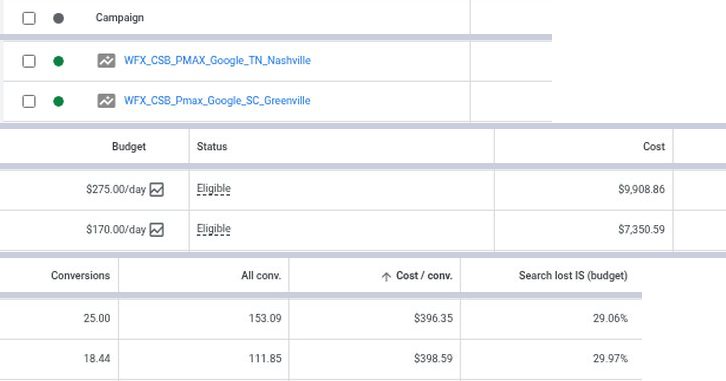
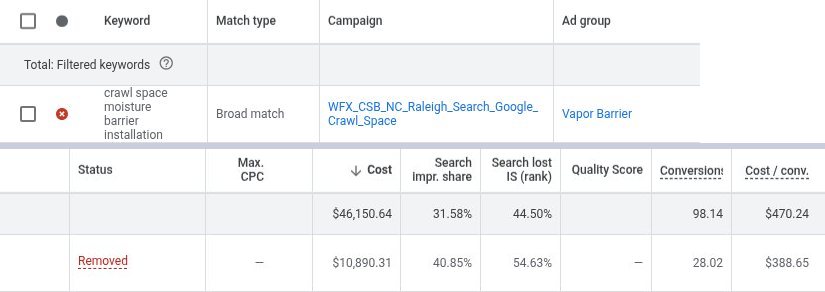
The number: NC brand ($305), SC brand ($346), PMax Nashville ($396) and Greenville ($399) lose 27% to 30% to budget: up to 29.4 more a month for $10,953 (a ceiling). Restore the removed winner (28 appointments at $389) in exact.
See it in your account (2 screenshots)
2Blood Work, on Meta
Clear the errors on Meta’s Schedule event and confirm it fires once per appointment set, then let Meta bid on it. Meta traffic moves to the topic page too.
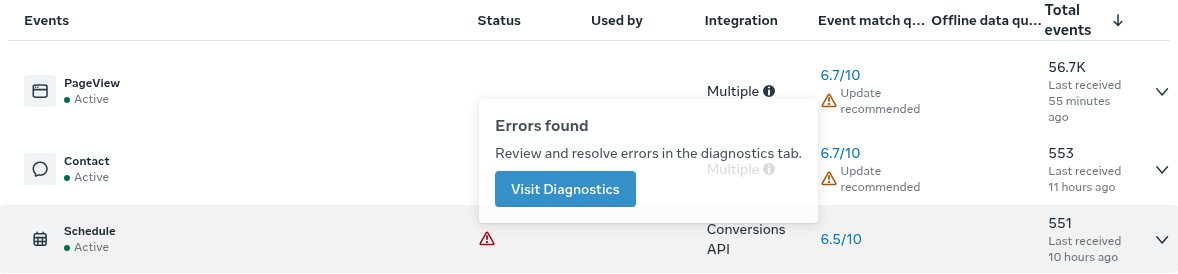
The number: if Schedule is a set appointment, Meta books at $314 ($66,653 for 212, Sep 1 to Nov 17), under $400. Unproven: Schedule arrives by Conversions API only, match quality 6.5 of 10, and Events Manager flags errors. 90% of Meta spend lands on Contact Us.
First moves, The First Aid Kit on Meta: pause the traffic campaign and the value-bid Schedule campaign ($10,087 in 90 days for 14 Schedules, about $720 each against $312 across Crawl Space Brothers’ Meta) and move the money to North Carolina, which books at $259.
See it in your account
3The Wrong Way
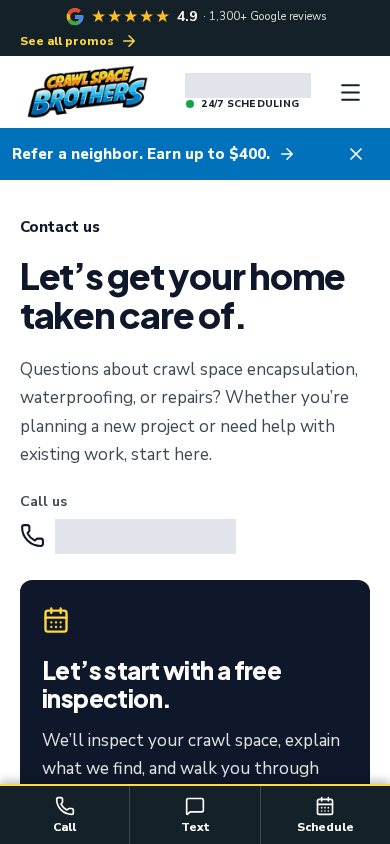
Point PMax and Meta at the topic page with the hero form, not Contact Us.
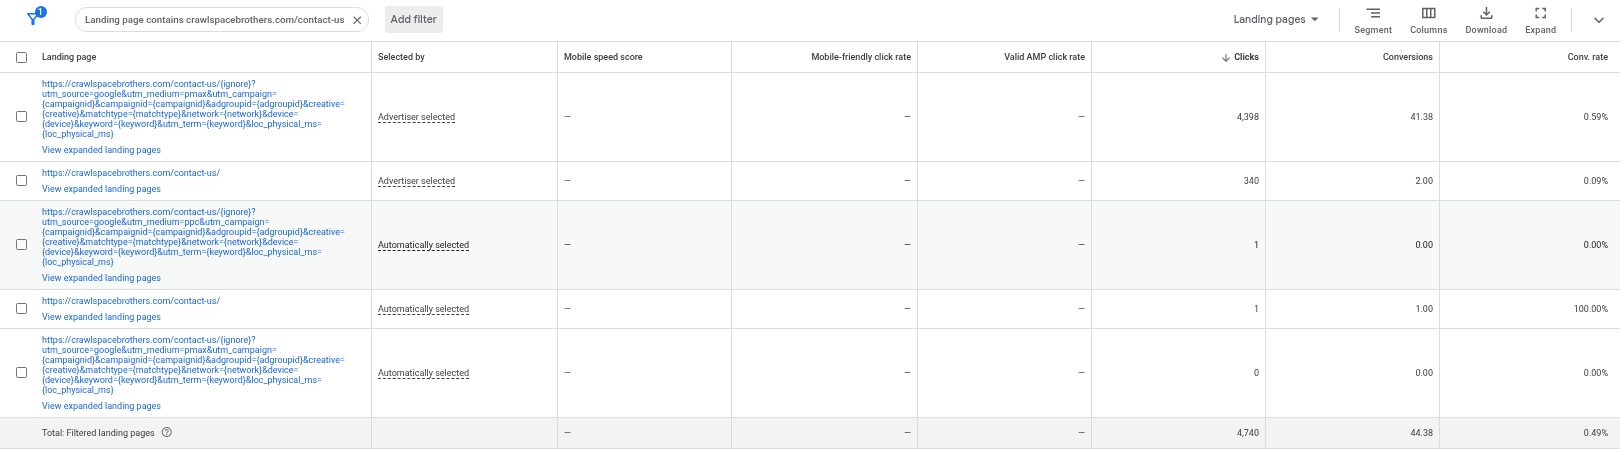
The number: Contact Us turns under 1% of clicks into appointments (44 in 90 days); the crawl space page 5.1%, encapsulation 6.9%. 93% of its clicks are PMax.
Narrowed, not diagnosed: PMax includes Display, YouTube and Discover clicks that convert lower on any page, so part of the gap is the traffic. The test settles it.
See it in your account (2 screenshots)
The rest of the list: 3 more plays
4Ready or Not, then The First Aid Kit
Switch AI Max off and stop the units over target; that money pays for the Gold Pan.
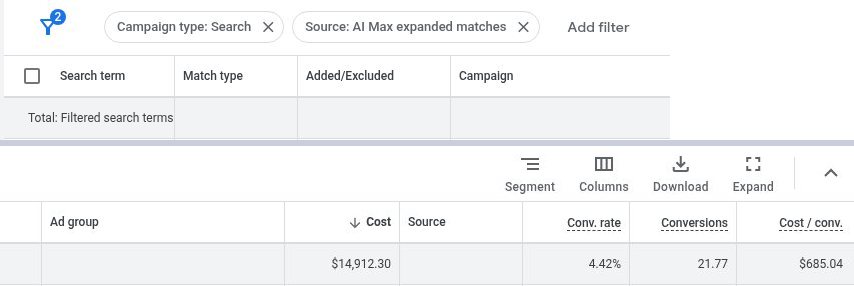
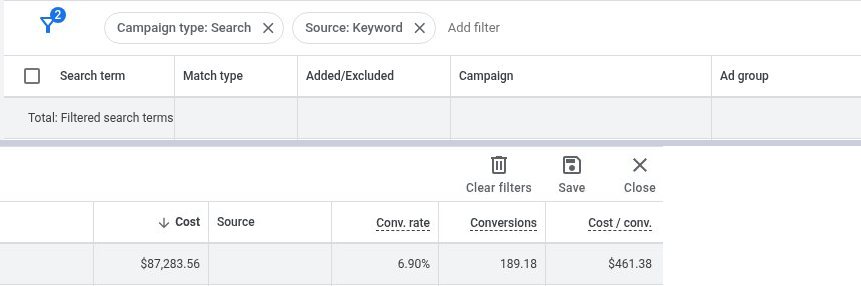
The number: AI Max books at $645 against $461 on keyword-matched terms (1.40x). The Tennessee crawl space campaign: $48,163 at $982 in 90 days.
See it in your account (3 screenshots)

5SKAGs vs STAGs
Tighten the winners’ ad groups so they win back the impression share they lose to rank.
The number: the 4 live keywords under $400 lose 35% to 58% to rank at Quality Score 4 to 5: room for up to 15.8 more a month (a ceiling).
6Blood Work
Widen the Sold and Estimate imports past 30 days, then make cost per sold job the scoreboard.
The number: 7.6% of the sold jobs Google keeps already land in days 21 to 30; anything later drops.
See it in your account
- Google, main account: Search + PMax.
- Meta, main account: prospecting and retargeting. Our read so far covers part of the account; the full grade comes first.
- One landing page test: the estimate-first encapsulation page (mock below) against Contact Us.

Also seen: 11 LSA accounts, a light pass. Greenville and Asheville left LSA in September; their PMax sits outside the main account’s CRM import.
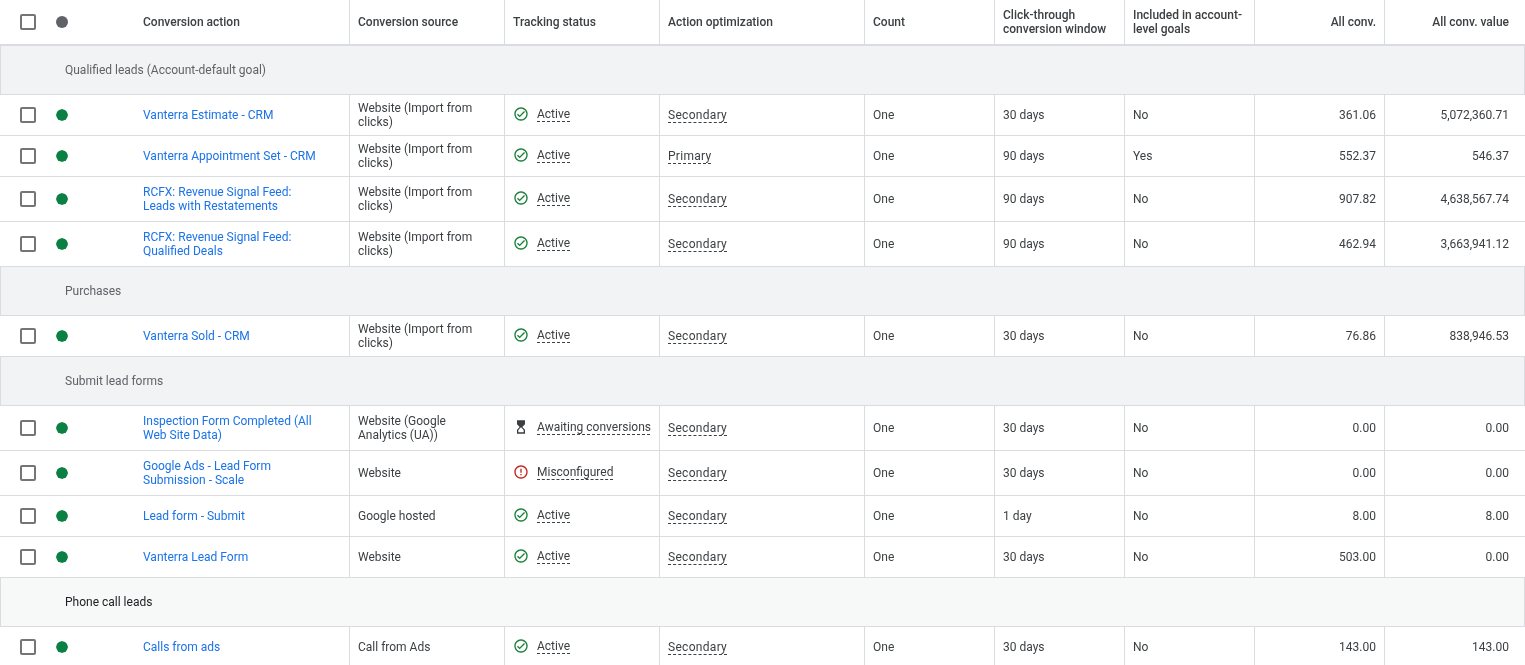
What we need from you: Meta’s Schedule arrives by Conversions API only: does your CRM fire it for every appointment set? · why Sold and Estimate import on 30 days, and how long appointment to sold really runs · what RCFX is · who runs which account.
Evidence: the goal math, months, ad groups
| Step | Appts a month | Dollars a month |
|---|---|---|
| Today (last 30 days) | 208.5 | $109,294 |
| Fund the under-$400 campaigns losing share to budget | +29.4 ceiling | $10,953 |
| Restore the removed winner in exact | +9.5 ceiling | $3,679 |
| Fund the live winners’ budget-lost share | +6.0 ceiling | $1,337 |
| Count only 70% of the possible gain | +31.4 | $15,969 |
| Pay for it by switching off all of AI Max ($9,309 a month) and $6,660 of Tennessee crawl space | minus 21.2 | minus $15,969 |
| After | 218.7 | $109,294 |
Months, Google’s count: cost per appointment fell every month, $1,141 in May to $479 in November 1 to 17. October stepped up: $136,941, PMax $33,173.
Feed by cost per sold job: PMax NC Raleigh $1,435 · NC brand $1,848 · SC brand $1,939. Tennessee Encapsulation books appointments at $950 but sold jobs at $2,849, which is why Blood Work comes before any cut.
Cut or fix: TN Vapor Barrier $14,876 (13.0 at $1,141, 1.5 sold) · Raleigh Foundation Repair $8,894 · Matthews Vapor Barrier $6,530 · PMax Asheville $6,369 · TN Crawl Space Services $6,304 · PMax Columbia $5,524.
Source: your Google Ads exports, read-only.
SafeBasements: $640 per appointment, then October’s pace
Google’s count, media only. October did 120.6 appointments at $580 on $69,982.
The stretch needs the ad fix to win back rank within 30 days: budget headroom covers 45% of the moved money.
| Window | Spend | Appts (each) | Sold (each) |
|---|---|---|---|
| 90 days 8/20 to 11/17 | $208,172 | 306.4 ($680) | 52.2 ($3,986) |
| Last 30 10/19 to 11/17 | $68,308 | 85.9 ($795) | still coming in |
| Best month October | $69,982 | 120.6 ($580) | 17.4 ($4,014) |
1Gold Pan Technique
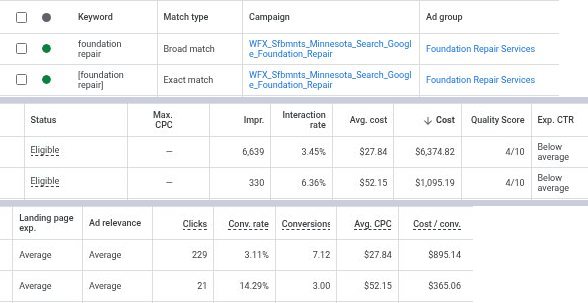
Isolate the keywords at or under the ceiling in exact match and force budget to them.
The number: 22 non-brand keywords book 41.0 appointments at $292 (90 days). Moving $6,294 a month there adds 15.7, priced at $400, not $292.
See it in your account
2We Are Never Ever Getting Back Together, on Meta
Exclude the appointment, sold and past-customer lists from the live lookalike, as the paused interest ad set already did, so prospecting stops paying to reach people they already have.
The number: the live prospecting ad set holds 72% of Meta spend and excludes no one. Meta pixel leads cost $1,287 each over 90 days ($25,740 for 20).
First moves, The First Aid Kit on Meta: cut that ad set from 29 live ads to the best 5, so one budget stops splitting 29 ways.
See it in your account
3The estimate-first page
Test the estimate-first foundation repair page (mock under Scope) on lp.safebasements.com/foundation-repair/.
The number: it is the page with the most Search clicks: 312 in 30 days, 4.3% to an appointment. Its 3,313 untagged clicks are PMax YouTube, which is why the page report reads near zero.
The rest of the list: 4 more plays
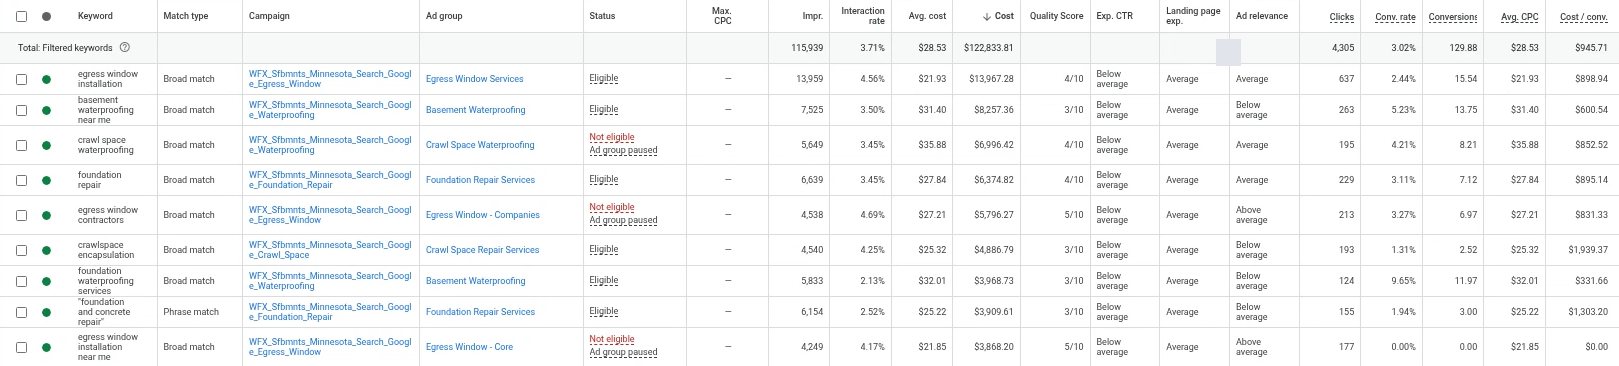
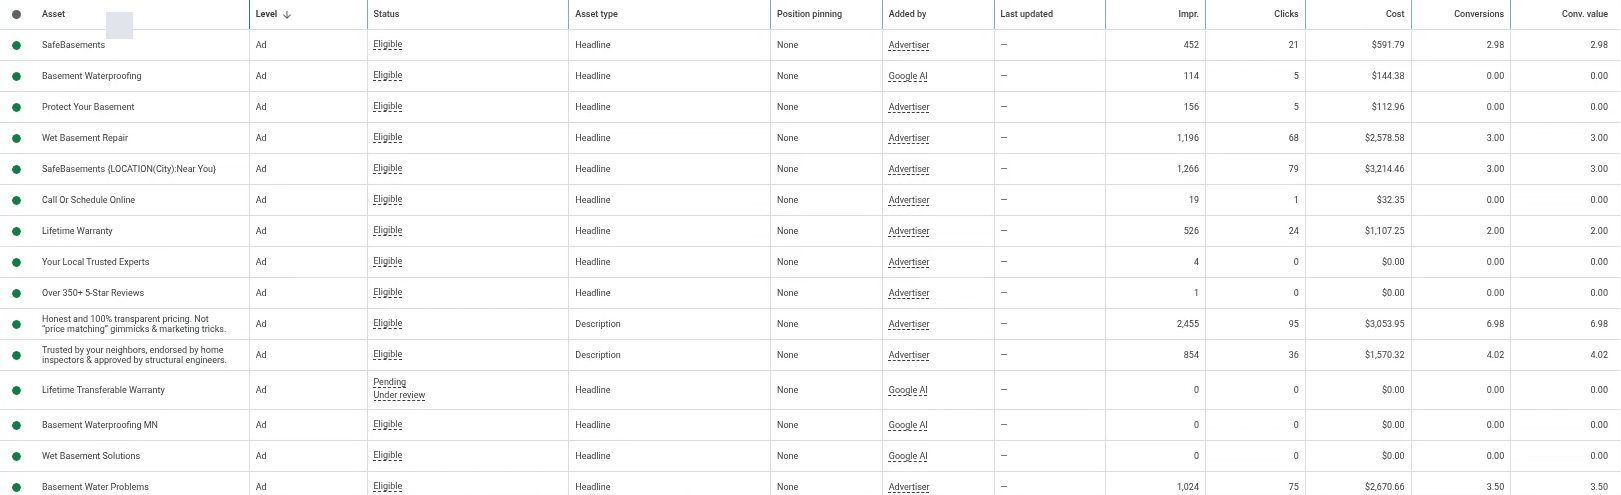
4The Ultimate Search Ad Copy Formula
Rewrite the ads on the winning keywords so the headline repeats the query.
The number: Expected CTR is below average on 82% of non-brand spend; rank costs the winners 34% of impressions, up to 38.6 appointments per 90 days (a ceiling).
See it in your account (2 screenshots)
5The 4 Conversion Intent Buckets
Brand, competitor, generic and informational in their own campaigns, with cross-campaign negatives.
The number: 38% of visible live spend sits on queries bought by 2 or more campaigns.
See it in your account
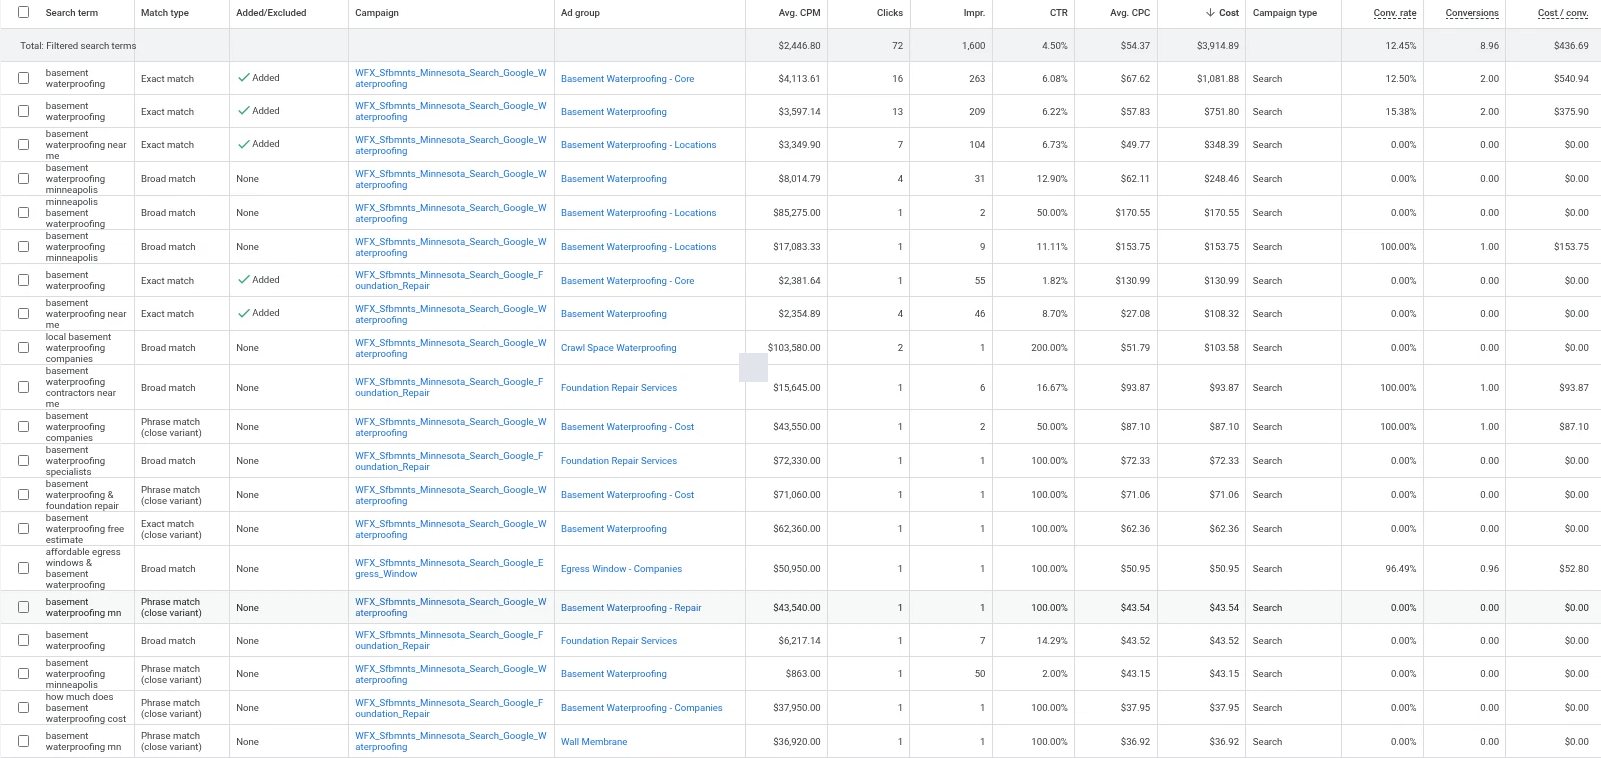
6The Black Box Break-In + The First Aid Kit
PMax search terms and negatives, a budget call on its non-Search share, and the off-intent sweep.
The number: PMax outside Search: $9,715 for 0.7 appointments. Off-intent terms: $6,617. $6,294 a month back in play.
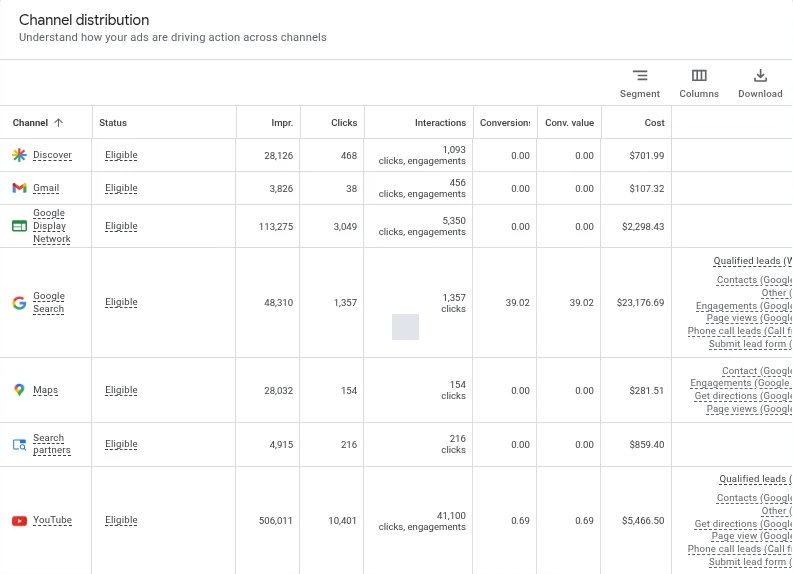
Last 30 days (Oct 20 to Nov 18): YouTube took 58% of Google clicks for 4.8% of spend and booked 0.6 appointments.
See it in your account (2 screenshots)
7Blood Work
Check the offline import path for LSA and the Meta event source before judging either on cost per appointment.
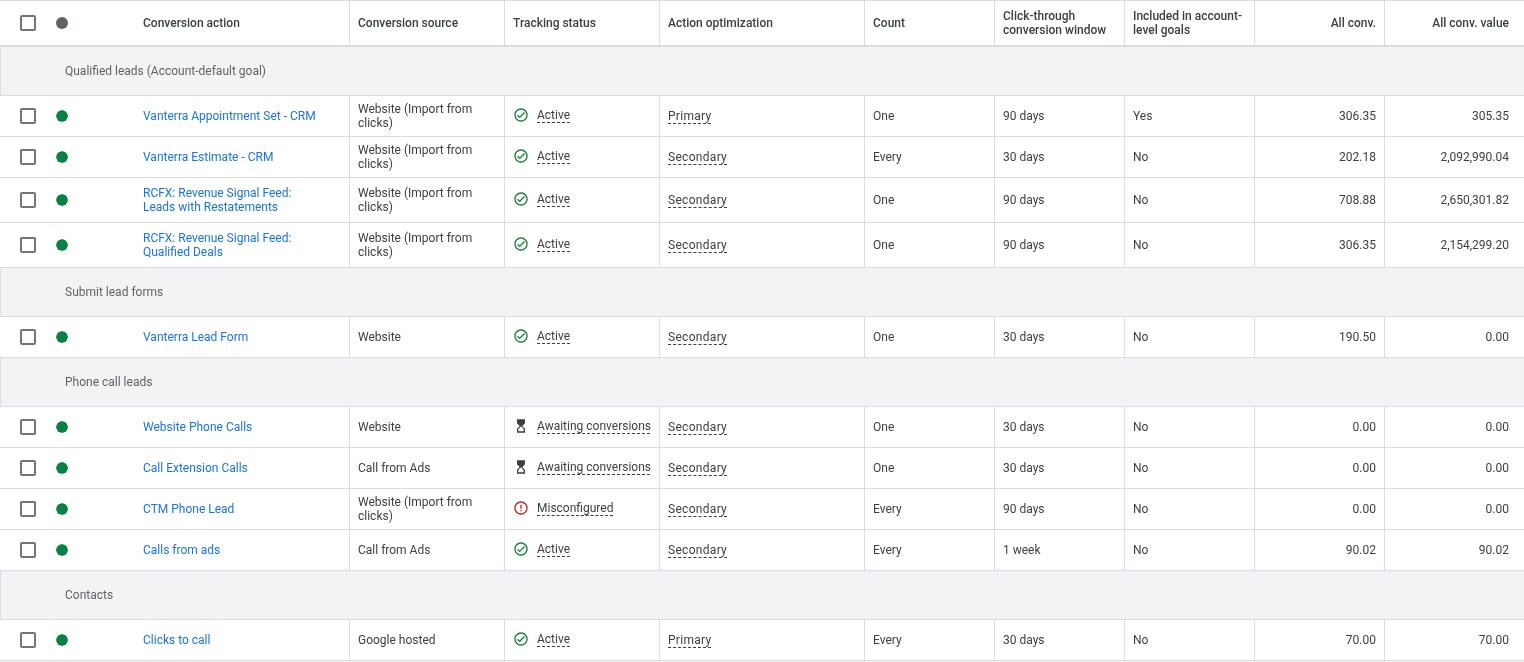
The number: 213 LSA leads credited with 18.9 appointments (8.9%).
See it in your account
- Google, one account: Search, PMax and LSA together.
- Meta, main account: prospecting and retargeting. Our read so far covers part of the account; the full grade comes first.
- One landing page test: the estimate-first foundation repair page (play 3).

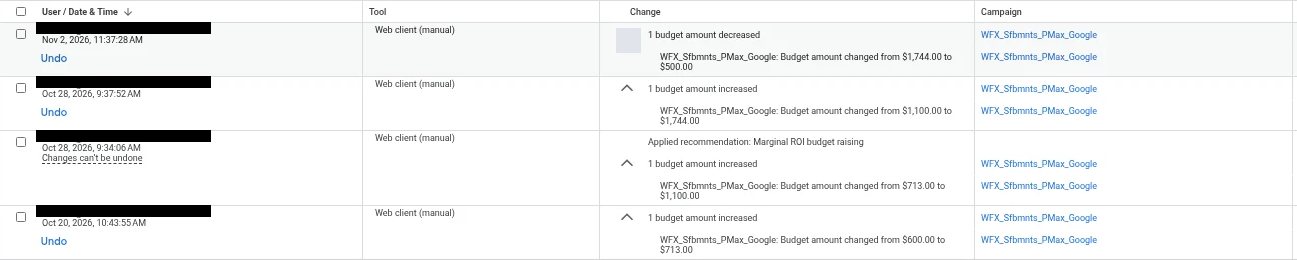
What we need from you: why PMax went from $713 to $1,744 a day on 10/28 (a Google budget recommendation, then a manual raise 3 minutes later) · which counties each location serves.
Evidence: months, buckets, ad groups
| Month | Spend | Appts | Each | Sold |
|---|---|---|---|---|
| May | $75,968 | 86.6 | $877 | 16.9 |
| Jun | $77,675 | 103.0 | $754 | 23.2 |
| Jul | $96,942 | 118.5 | $818 | 24.1 |
| Aug | $77,002 | 73.0 | $1,055 | 14.8 |
| Sep | $70,866 | 96.9 | $731 | 21.0 |
| Oct | $69,982 | 120.6 | $580 | 17.4 |
| Nov 1 to 17 | $34,928 | 43.9 | $796 | 7.2 |
Why the last 30 days read $795: non-brand Search costs $920 per appointment (90 days) · PMax ran $20,149 for 15.1 appointments ($1,331) in the last 30 days · LSA is 11% of the last 30 days’ spend inside this account and Google rarely credits it.
By bucket, 90 days: brand $13,785 for 95.3 ($145) · non-brand Search $140,214 for 152.4 ($920) · PMax $32,892 for 39.7 ($828) · LSA $21,281 for 18.9 ($1,125). Brand is 7% of spend and 31% of appointments.
By cost per sold job: Brand $807 · Basement Waterproofing - Core $1,099 (paused; rebuild it as exact) · Egress Window Services $6,362 (cut and rebuild).
Source: your Google Ads exports, read-only.
SEO is included: no separate SEO fee
Three months of work on all three brands. Month 1 sets the baseline; SEO’s targets for months 4 to 6 come from it, separate from paid + CRO.

Profile call taps: SEO’s scoreboard already exists
4,049 in 2026 vs 4,399 in 2025, down 8.0% · May 15 to Nov 12
Not like-for-like yet: 11 new leases, and taps are not calls. Your Google Business Profile exports, as printed in our 3-month search plan.
Set the baseline
- Baseline: organic clicks, profile call taps and website clicks.
- The first 58 Foundations page decisions: which city pages stay, merge or go, starting with the ones that earn clicks.
- The job story intake form, so crews can send a finished job in a few minutes.
- Send three finished jobs you already have photos or video for, one per brand.
58 Foundations pages and stories
- The full 58 Foundations page list: keep, merge or cut.
- 3 job stories, one per brand.
- Publish the job stories.
SafeBasements pages and pricing
- The SafeBasements page list.
- 3 more job stories.
- A pricing content spec for Crawl Space Brothers.
- Send 3 more finished jobs and approve the pricing ranges to publish.
Measured against targets
- Measure against the targets set from the month 1 baseline, year over year.
- Agree those targets with us at the end of month 1.
From our 3-month search plan. Tab 6 shows it next to paid + CRO.
What else the baseline shows
Organic search clicks fell on all three (Aug 16 to Nov 15, year over year): 58 Foundations down 19%, Crawl Space Brothers down 47%, SafeBasements down 28%.
SafeBasements’ homepage, where every SB profile links, fell 56% (1,053 to 464 clicks), alongside its 53% tap drop. A lead to check, not a diagnosed cause.
Map-pack position is unknown: only a geo-grid tool sees it.
Source: your Google Search Console data, read-only.
The next 3 months: what we do, what we need from you
Every brand, the same order: fix what bidding reads, move money to what books, then hold the goal.

Fix what bidding reads
- Blood Work on all 3: the Sold and Estimate import windows, the phone-call import, Meta’s Schedule event.
- The First Aid Kit: stop the units that fail on both appointments and sold jobs.
- The Black Box Break-In: PMax search terms, negatives and its YouTube share.
- Spec the estimate-first page for each brand.
- Set the baseline.
- The first 58 Foundations page decisions.
- The job story intake form.
- Access: Google, Meta and the CRM import.
- Held counts by brand, and the target for each location.
- Who runs which account today.
- Three finished jobs with photos or video, one per brand.
Move money to what books
- Gold Pan: budget to the keywords and campaigns booking under goal.
- Step 58’s target costs toward $400, 20% or less per move.
- Ad copy and ad group splits on the winners.
- Meta: rebuild prospecting from the center out.
- The full 58 Foundations page list.
- 3 job stories, one per brand.
- Build the estimate-first page in your CMS; we check it before it goes live.
- Approve the page test and the Meta rebuild.
- Publish the job stories.
Hold the goal
- Hold each brand at its goal in Google’s count.
- Report sets, held and cost per held, brand by brand.
- The SafeBasements page list.
- 3 more job stories.
- A pricing content spec for Crawl Space Brothers.
- Send held counts by brand each month, so cost per held is your number, not ours.
- Send 3 more finished jobs and approve the pricing ranges to publish.
Step up what holds
- Spend steps up only after a brand holds its goal for 2 weeks.
- Measured against the targets set from the month 1 baseline, year over year.
- Held counts by brand, each month.
The paid and CRO months come from the plays on tabs 2 to 4. The SEO lines come from our 3-month search plan.
One fee covers all of it: paid, pages, creative, SEO and reporting
58 Foundations, Crawl Space Brothers and SafeBasements. Nothing below is billed on top.

Paid media and creative
- Google: Search and PMax on all three brands, plus LSA for SafeBasements.
- Meta: prospecting and retargeting.
- Ad copy and creative for Google and Meta.
Pages (CRO)
- The estimate-first page for each brand: we spec it and check it before it goes live.
- One page test per brand.
SEO, all three brands
- The baseline, the page decisions and the job stories (tabs 5 and 6).
- Targets for months 4 to 6, set from the month 1 baseline.
Reporting
- Sets, held and cost per held, brand by brand, every month.
- Tracking fixes so bidding reads the right numbers.
Not in this start
- Site rebuilds and CMS development: your team builds the pages.
- Business profile cleanup and address edits.
- Your other brands.
A 3-month start, then it renews for 3 months at a time, with 30 days’ notice.